The Quality tab
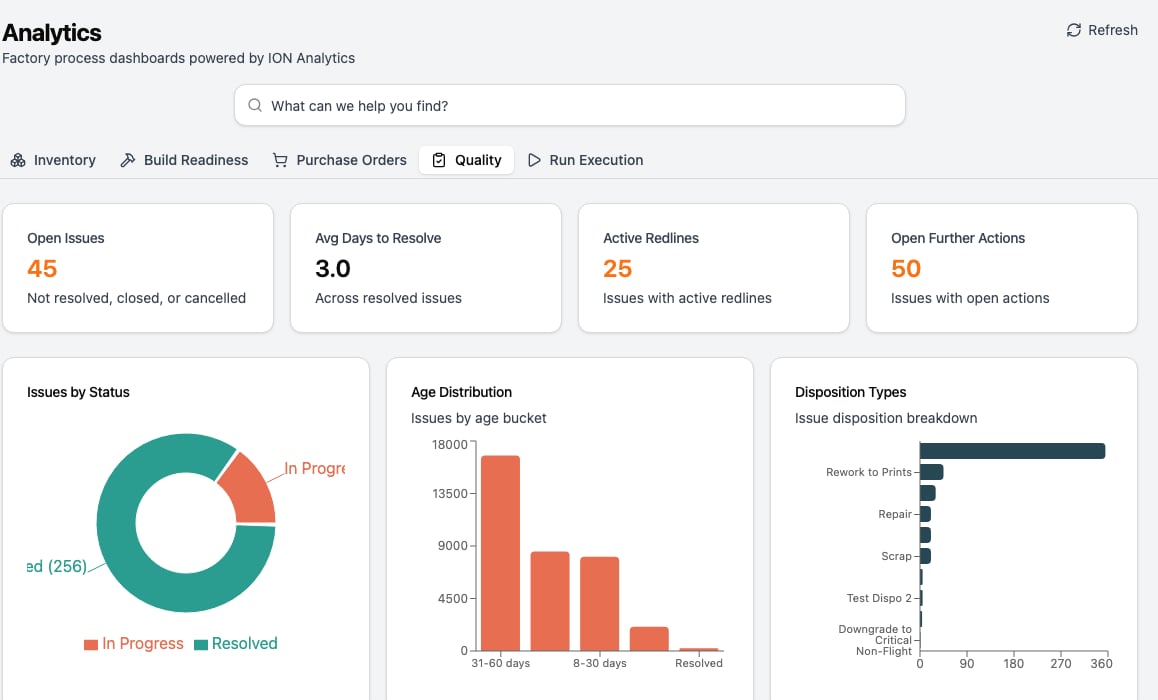
In Analytics, the Quality tab shows prebuilt, read-only views of your open quality work:- Open issues, and the average days to resolve them.
- Issues by status, and an age distribution.
- A breakdown of issues by disposition type.
- Open redline and further action counts.
Build your own quality reports
For anything beyond the Quality tab, query the quality data yourself. Thequality_metrics and issue_details data products pre-join issue data (status, disposition, redlines, further actions, parts, and lifecycle timestamps) so you don’t have to assemble it. Reach them through the Data Connector, a read-only SQL analytics layer you point a BI tool at, or query the GraphQL API.
For the full data model, available tables, and refresh cadence, see Analytics and Dashboards.