Execution logs are kept for 30 days. After that, they are permanently deleted.
Open the logs
You can reach execution logs two ways:- From the Actions page: select View Execution Logs in the header to open a table of all execution logs.
- From a single action: open the action and select the Executions tab, next to Context and Code, to see logs for that action only.
Search and filter
The search bar above the table matches on the action ID, request ID, target record ID, target, and event.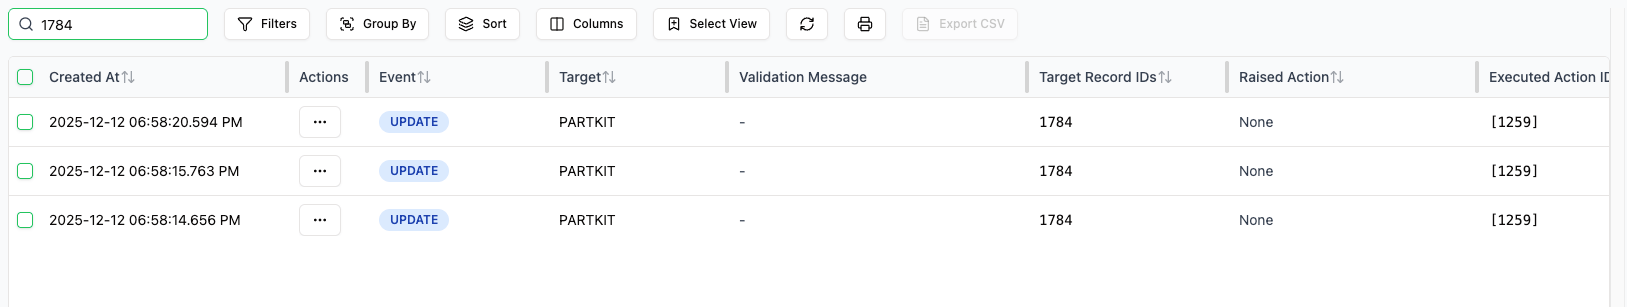
Table actions
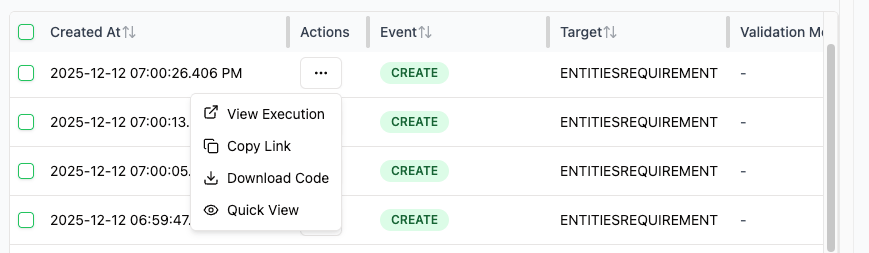
The Actions column on each row gives you quick ways to work with a log:- View Execution: open the execution log page.
- Copy Link: copy a link to the execution log page.
- Download Code: download the executed code as a Python file.
- Quick View: open a dialog with a glimpse of the execution code.
Download code and debug locally
Use Download Code to save the executed code as a Python file. To download several at once, select multiple rows and use the action bar at the bottom to get a Zip with one Python file per log.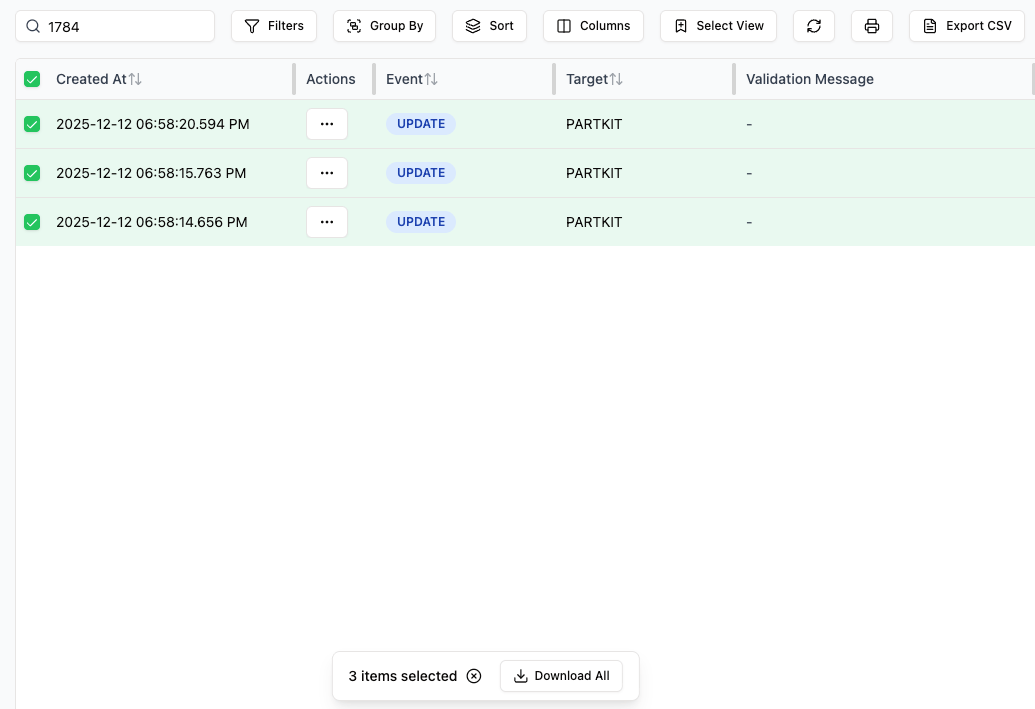
python3 name_of_log_file.py in your terminal to reproduce the action’s exact output. Edit the file and run it again until you get the result you want, then move your changes back into the action.
Quick view
Quick View opens a dialog with the executed code, the timestamp, and high-level metadata. Use the arrows, or the left and right arrow keys, to move to the next log. Navigation follows the logs shown in the table.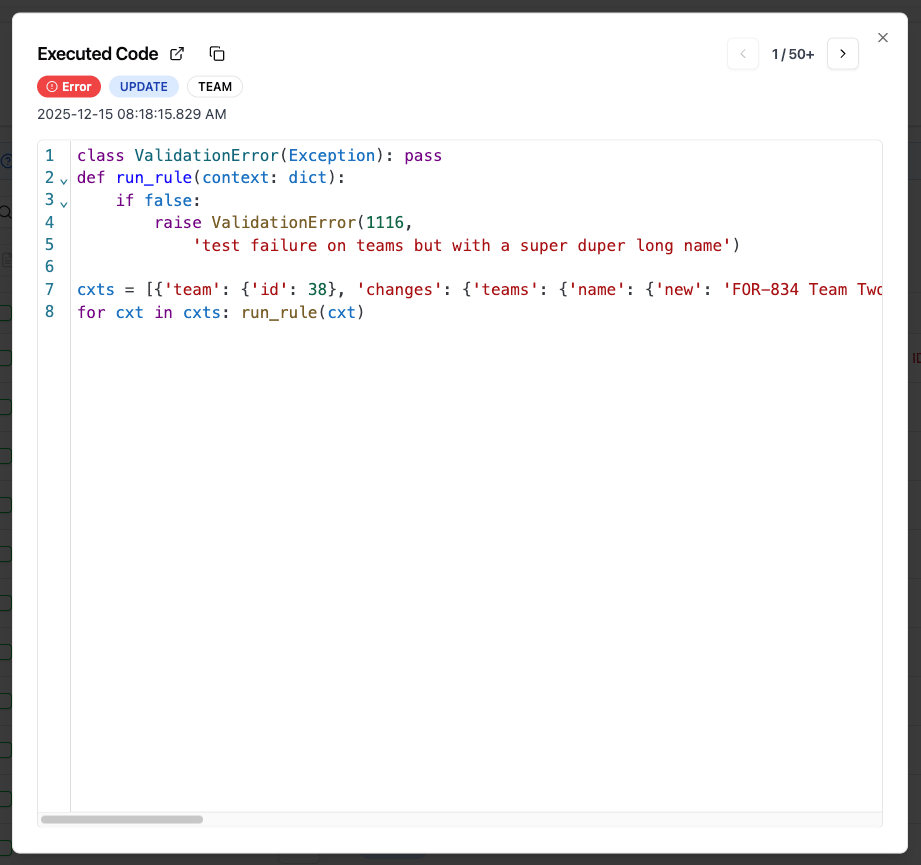
The execution log page
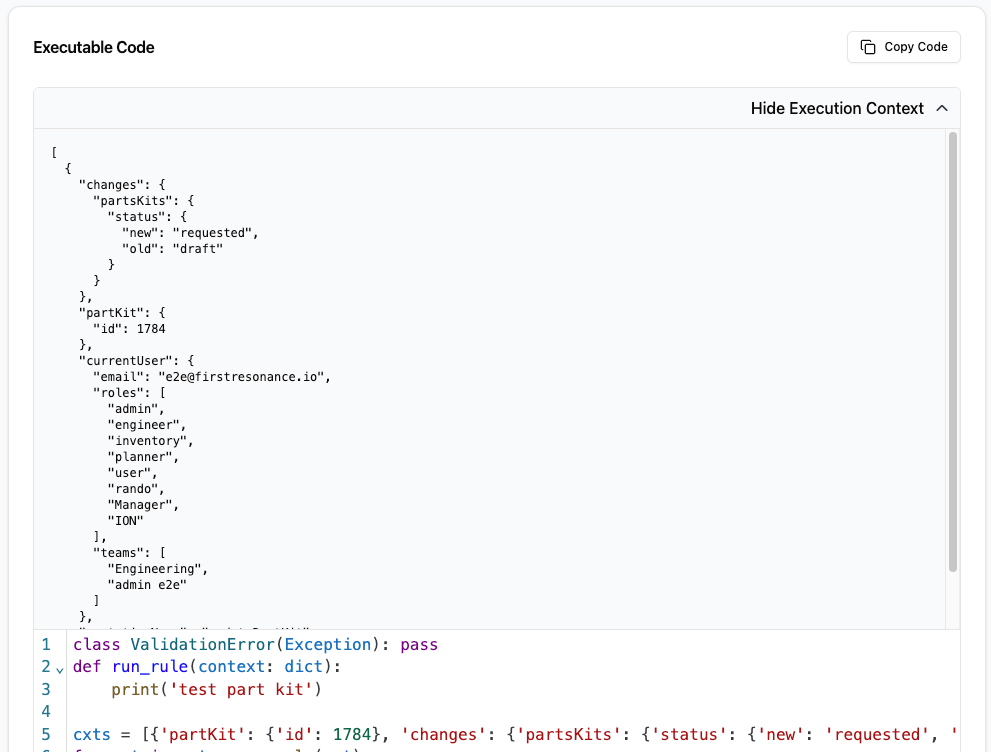
Open a log by selecting its timestamp or View Execution. The page shows all metadata along with the code and context that ran.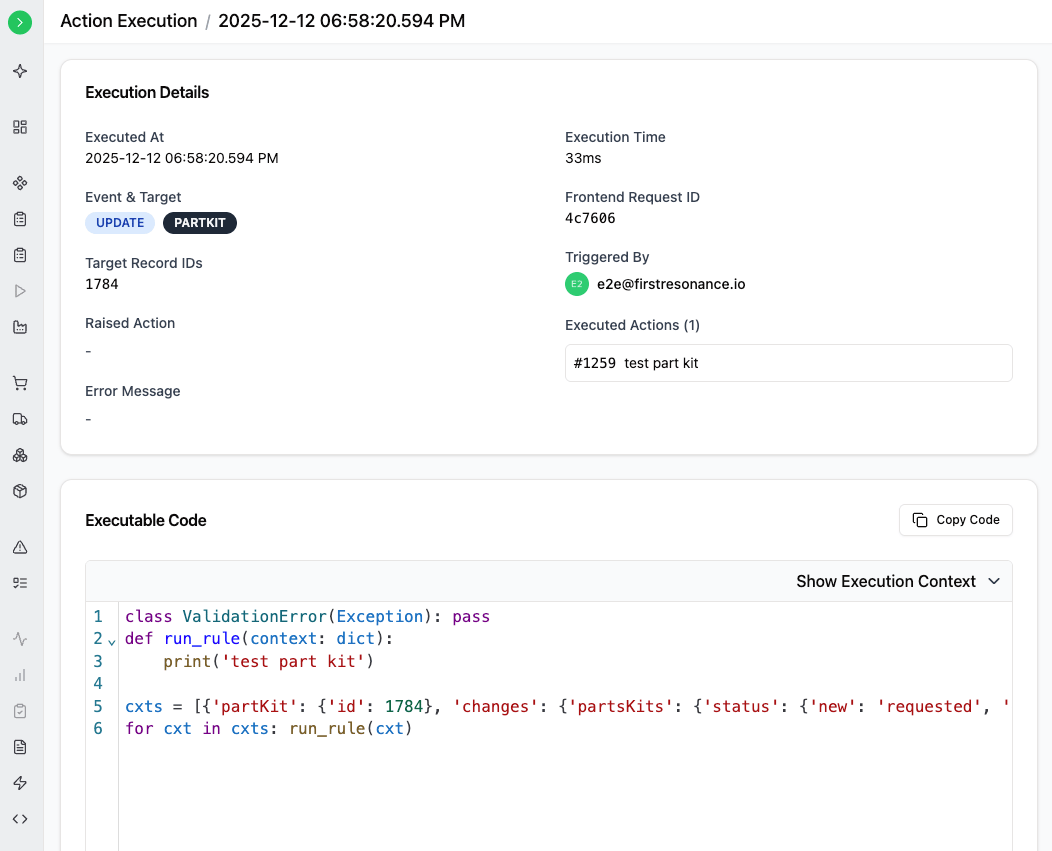
Log fields
Each log contains the code, context, and metadata from the run:| Field | Description |
|---|---|
| Created At | When the log was created, matching when the action was triggered. |
| Event | The event that triggered the action. |
| Target | The type of record the action ran against, such as Part Inventory or Run Step. |
| Target Record ID | The ID of the target record. An UPDATE event with target PART and target record ID 34 means the action was triggered by updating part 34. |
| Validation Message | The message raised by the action, either the expected validation message or a Python error such as a SyntaxError or NameError that occurred while the action ran. |
| Raised Action | The action that raised the validation message. |
| Executed Action IDs | Every action that ran in the log. |
| Execution Time | How long the action took to run, in milliseconds. |
| ION Request ID | The ID of the request during which the log was created. It also appears on the error toast shown when an action fails. |
| Triggered By | The person whose operation triggered the action. |
Related
- Manage actions to author the actions these logs come from